Page Not Found
Page not found. Your pixels are in another canvas.
A list of all the posts and pages found on the site. For you robots out there is an XML version available for digesting as well.
Page not found. Your pixels are in another canvas.
About me
This is a page not in th emain menu
Published:
This post will show up by default. To disable scheduling of future posts, edit config.yml and set future: false.
Published:
This is a sample blog post. Lorem ipsum I can’t remember the rest of lorem ipsum and don’t have an internet connection right now. Testing testing testing this blog post. Blog posts are cool.
Published:
This is a sample blog post. Lorem ipsum I can’t remember the rest of lorem ipsum and don’t have an internet connection right now. Testing testing testing this blog post. Blog posts are cool.
Published:
This is a sample blog post. Lorem ipsum I can’t remember the rest of lorem ipsum and don’t have an internet connection right now. Testing testing testing this blog post. Blog posts are cool.
Published:
This is a sample blog post. Lorem ipsum I can’t remember the rest of lorem ipsum and don’t have an internet connection right now. Testing testing testing this blog post. Blog posts are cool.
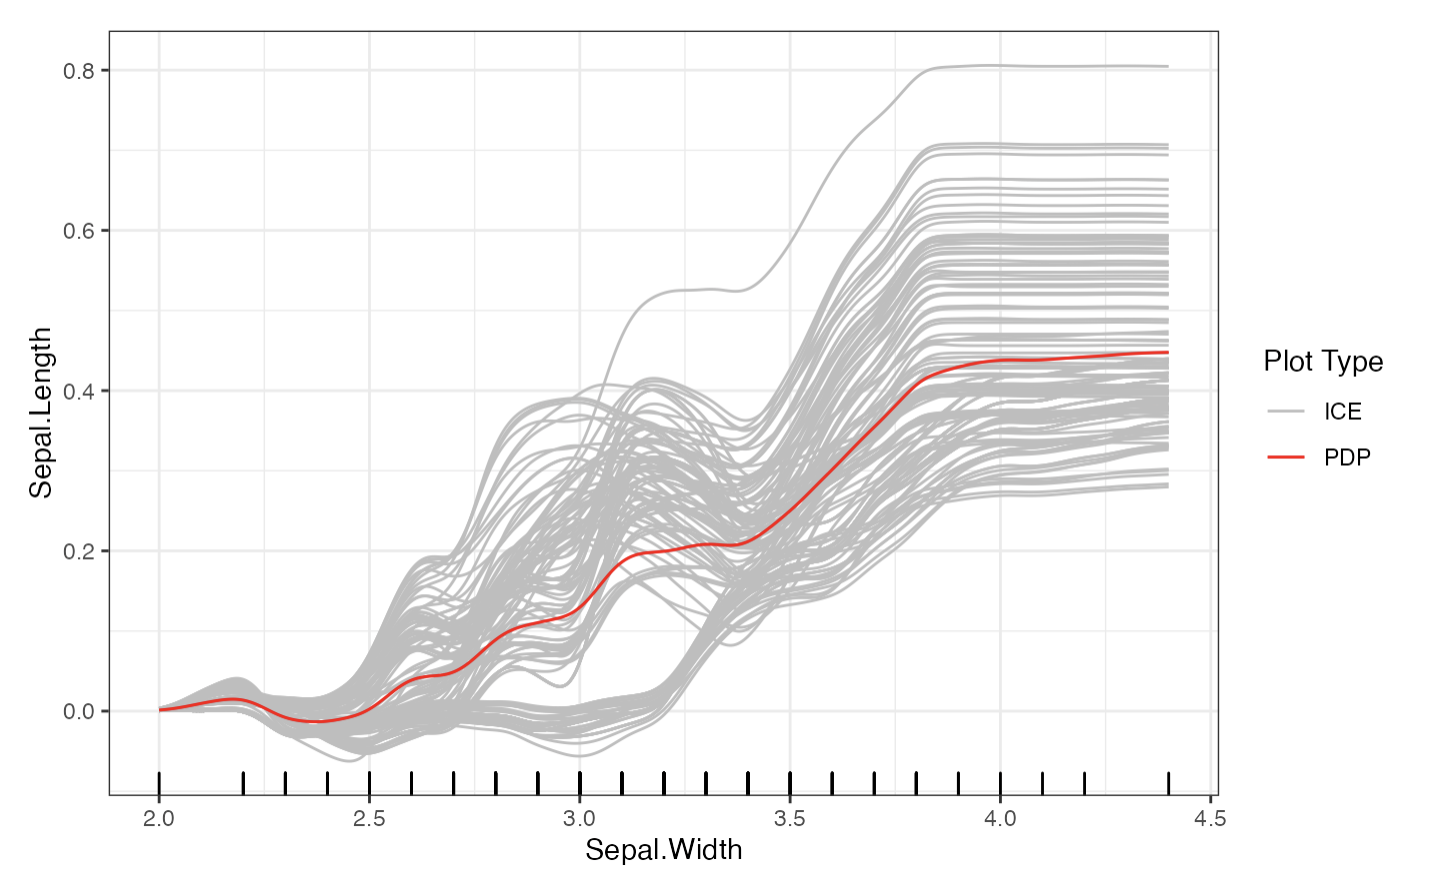
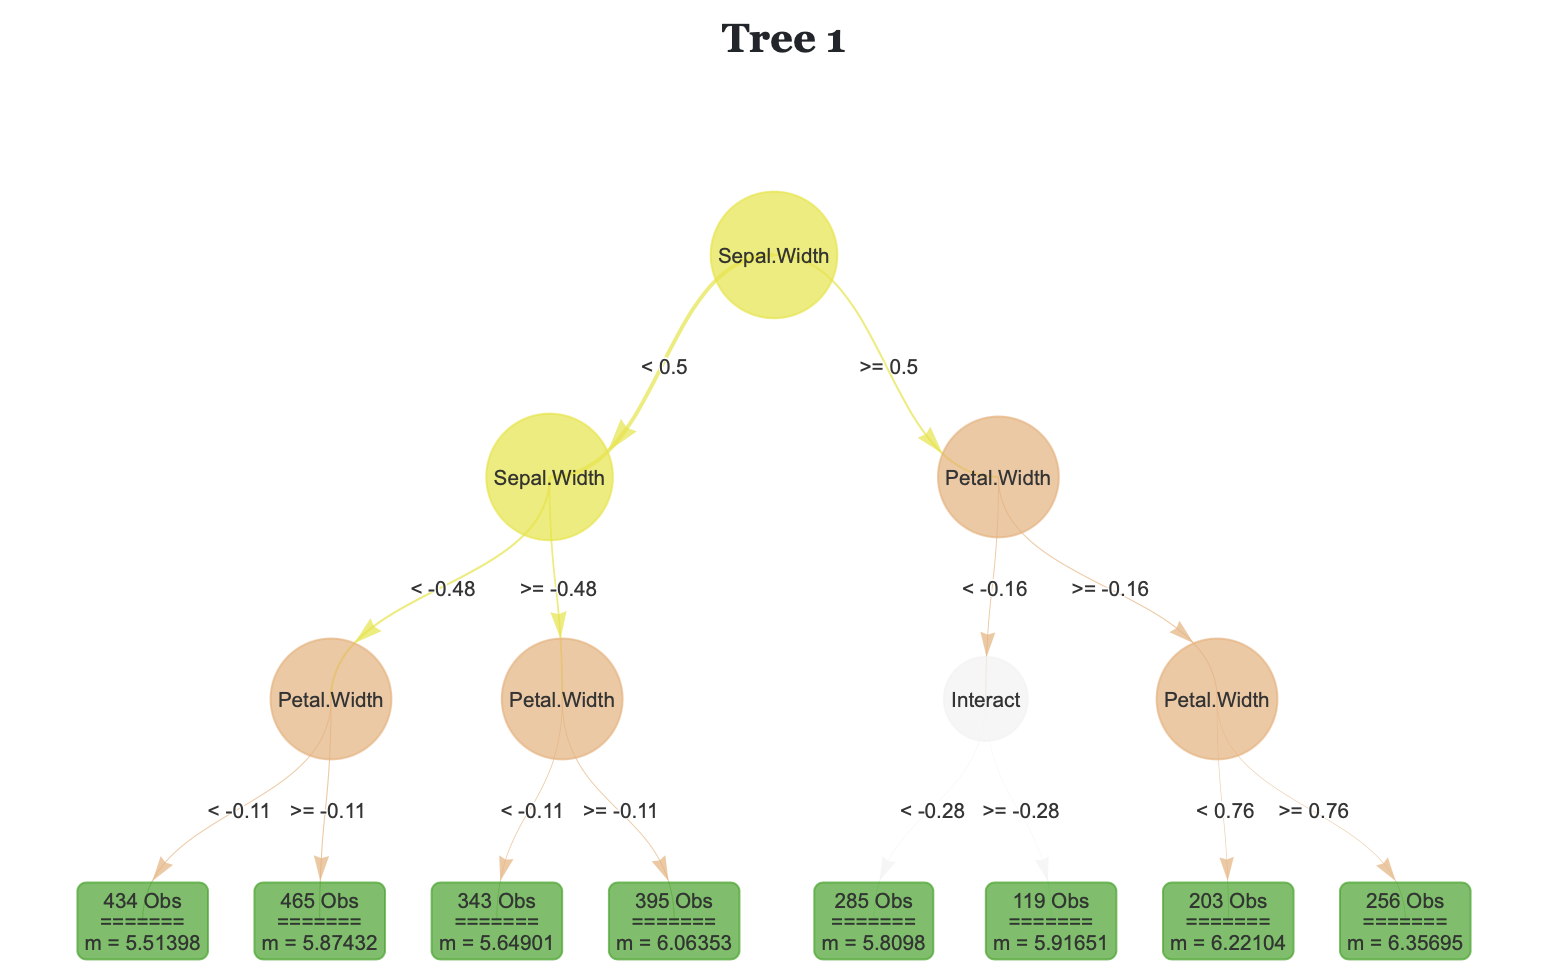
distillML provides several methods for model distillation and interpretability for general black box machine learning models. This package provides implementations of the partial dependence plot (PDP), individual conditional expectation (ICE), and accumulated local effect (ALE) methods, which are model-agnostic interpretability methods (work with any supervised machine learning model). This package also provides a novel method for building a surrogate model that approximates the behavior of its initial algorithm. Below, we provide a simple example that outlines how to use this package. For further details on surrogate distillation, advanced interpretability features, or local surrogate methods, see the articles provided in the documentation. You can install the package from CRAN. For the source code for both packages, see the Github  .
.
Rforestry is a fast implementation of Honest Random Forests, Gradient Boosting, and Linear Random Forests, with an emphasis on inference and interpretability. For the Python package, see the Documentation and install from PIP. For the R package, see the Documentation and install from CRAN. For the source code for both packages, see the Github  .
.
Published in Working, 2021
arxiv link
We argue that randomized controlled trials (RCTs) are special even among settings where average treatment effects are identified by a nonparametric unconfoundedness assumption. This claim follows from two results of Robins and Ritov (1997): (1) with at least one continuous covariate control, no estimator of the average treatment effect exists which is uniformly consistent without further assumptions, (2) knowledge of the propensity score yields a uniformly consistent estimator and honest confidence intervals that shrink at parametric rates with increasing sample size, regardless of how complicated the propensity score function is. We emphasize the latter point, and note that successfully-conducted RCTs provide knowledge of the propensity score to the researcher. We discuss modern developments in covariate adjustment for RCTs, noting that statistical models and machine learning methods can be used to improve efficiency while preserving finite sample unbiasedness. We conclude that statistical inference has the potential to be fundamentally more difficult in observational settings than it is in RCTs, even when all confounders are measured.
Published in Journal of Computational and Graphical Statistics 31 (3), 917-934, 2022
arxiv link
Regression trees and their ensemble methods are popular methods for nonparametric regression: they combine strong predictive performance with interpretable estimators. To improve their utility for locally smooth response surfaces, we study regression trees and random forests with linear aggregation functions. We introduce a new algorithm that finds the best axis-aligned split to fit linear aggregation functions on the corresponding nodes, and we offer a quasilinear time implementation. We demonstrate the algorithm’s favorable performance on real-world benchmarks and in an extensive simulation study, and we demonstrate its improved interpretability using a large get-out-the-vote experiment. We provide an open-source software package that implements several tree-based estimators with linear aggregation functions.
Published in Working, 2022
arxiv link
Bayesian Additive Regression Trees (BART) is a popular Bayesian non-parametric regression algorithm. The posterior is a distribution over sums of decision trees, and predictions are made by averaging approximate samples from the posterior. The combination of strong predictive performance and the ability to provide uncertainty measures has led BART to be commonly used in the social sciences, biostatistics, and causal inference. BART uses Markov Chain Monte Carlo (MCMC) to obtain approximate posterior samples over a parameterized space of sums of trees, but it has often been observed that the chains are slow to mix. In this paper, we provide the first lower bound on the mixing time for a simplified version of BART in which we reduce the sum to a single tree and use a subset of the possible moves for the MCMC proposal distribution. Our lower bound for the mixing time grows exponentially with the number of data points. Inspired by this new connection between the mixing time and the number of data points, we perform rigorous simulations on BART. We show qualitatively that BART’s mixing time increases with the number of data points. The slow mixing time of the simplified BART suggests a large variation between different runs of the simplified BART algorithm and a similar large variation is known for BART in the literature. This large variation could result in a lack of stability in the models, predictions, and posterior intervals obtained from the BART MCMC samples. Our lower bound and simulations suggest increasing the number of chains with the number of data points.
Published:
This is a description of your talk, which is a markdown files that can be all markdown-ified like any other post. Yay markdown!
Published:
This is a description of your conference proceedings talk, note the different field in type. You can put anything in this field.
Graduate Course, University of California, Berkeley, Department of Statistics, 2022
Served as the GSI for Berkeley’s graduate applied statistics course.